Chapter 6 Enginereing Sustainability: Life Cycle Assessment#
1. Introduction#

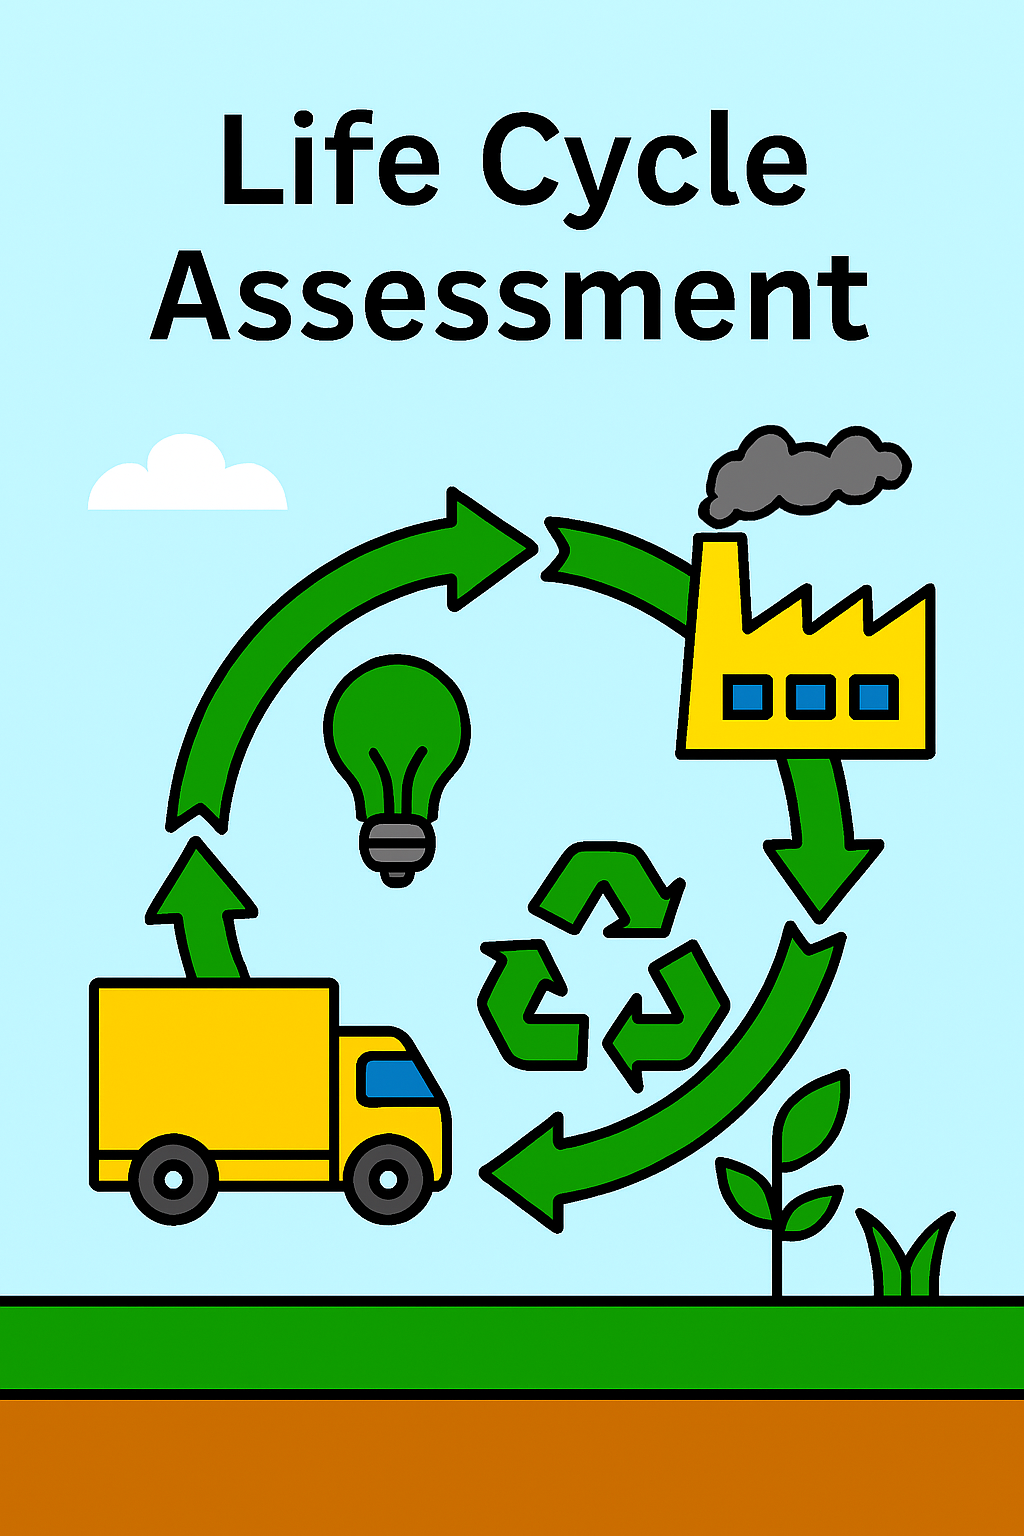
Fig. 44 **Figure 6.11 **: Components of Life Cycle Assessment#
🌍 Life Cycle Assessment (LCA)#
🧭 Definition#
Life Cycle Assessment (LCA) is a systematic method for evaluating the environmental impacts associated with all stages of a product’s life—from raw material extraction to disposal or recycling. It helps identify opportunities to improve sustainability across the supply chain.
🧩 Core Components (ISO 14040/14044)#
Goal and Scope Definition
Define purpose, system boundaries, and functional unit
Identify intended audience and application
Life Cycle Inventory (LCI)
Quantify inputs (materials, energy) and outputs (emissions, waste) for each stage
Life Cycle Impact Assessment (LCIA)
Translate inventory data into impact categories (e.g., climate change, eutrophication)
Interpretation
Analyze results, identify hotspots, and recommend improvements
🔄 Types of Life Cycle Models#
Model |
Description |
|---|---|
Cradle-to-Grave |
Full cycle: raw materials → production → use → disposal |
Cradle-to-Gate |
Partial cycle: raw materials → production (excludes use/disposal) |
Cradle-to-Cradle |
Circular model: materials reused or recycled indefinitely |
Gate-to-Gate |
Focus on a single process or facility |
Well-to-Wheel |
Used in fuel systems: extraction → vehicle use |
Economic IO-LCA |
Uses economic data to estimate impacts when specific data is unavailable |
🌱 Importance in Sustainable Development#
Supports SDG 12 (Responsible Consumption) and SDG 13 (Climate Action)
Avoids burden shifting across life cycle stages
Enables eco-design, green procurement, and policy development
Informs Environmental Product Declarations (EPDs) and carbon footprinting
♻️ Cradle-to-Cradle vs Cradle-to-Gate#
Aspect |
Cradle-to-Cradle |
Cradle-to-Gate |
|---|---|---|
Scope |
Full circular loop: reuse/remanufacture/recycle |
Up to factory gate: excludes use and disposal |
Goal |
Eliminate waste, promote circular economy |
Focus on production efficiency |
Use Case |
Circular product design, long-term sustainability |
Initial footprinting, EPDs |
Certification |
C2C Certified™ (material health, reuse, energy, etc.) |
Often used in ISO-compliant LCAs |
🧠 Types of LCA Studies#
Type |
Purpose |
|---|---|
Attributional LCA |
Describes current environmental flows within a system |
Consequential LCA |
Evaluates future impacts of decisions or changes |
Comparative LCA |
Compares two products/processes under consistent boundaries |
Optimized LCA |
Assesses improvements over baseline designs |
Social LCA |
Evaluates social and socio-economic impacts across life cycle |
Life Cycle Costing (LCC) |
Adds economic dimension to LCA (e.g., total cost of ownership) |
LCSA |
Life Cycle Sustainability Assessment: integrates environmental, social, and economic aspects |
📘 Summary#
Life Cycle Assessment is a powerful tool for quantifying environmental impacts, guiding sustainable design, and supporting policy and product innovation. Whether used for cradle-to-gate footprinting or cradle-to-cradle circularity, LCA enables informed decisions aligned with global sustainability goals.
References#
[Hauschild et al., 2018] is widely regarded as one of the most comprehensive and pedagogically structured introductions to LCA. It covers: - History and context of LCA - Detailed methodology with evolving examples - Applications in energy, construction, transport, nanotech, and more - Advanced topics like prospective LCA, social LCA, and life cycle costing - Includes an LCA report template and full example report. []is the foundational international standard that defines the principles and framework for conducting a Life Cycle Assessment (LCA) which provides a consistent structure for evaluating the environmental impacts of products, processes, or services across their entire life cycle.
Enhanced Life Cycle Assessment (LCA) Simulation#
Overview#
This interactive model estimates the environmental impacts of a system, product, or project across its life cycle stages. It supports sustainability evaluation by calculating:
🌍 Global Warming Potential (GWP) in kg CO₂-eq
💧 Water Use in cubic meters (m³)
⚡ Energy Consumption in megajoules (MJ)
🧮 Carbon Footprint based on energy use and carbon intensity
Life Cycle Stages#
The model evaluates four key stages:
Stage |
Description |
|---|---|
Production |
Raw material extraction and manufacturing |
Transport |
Delivery and logistics |
Operation |
Use-phase energy and resource consumption |
End-of-Life |
Disposal, recycling, or decommissioning |
Each stage has default impact factors per unit, which are scaled by the system type and quantity.
Impact Calculations#
🔹 Global Warming Potential (GWP)#
🔹 Water Use#
🔹 Energy Consumption#
🔹 Carbon Footprint#
Interactive Controls#
Units: Quantity of the system being evaluated
System Type: Infrastructure, Consumer Product, Energy System, Water Treatment
Carbon Intensity: Emissions per MJ of energy (adjustable for renewable vs fossil sources)
Plot Toggle: Show/hide bar chart visualization
Visualization#
The model displays a grouped bar chart showing impact per stage for:
GWP (kg CO₂-eq)–Water Use (m³)- Energy (MJ) - Carbon Footprint (kg CO₂)
This helps identify which stages dominate environmental impacts and where improvements can be made.
Use Cases#
Sustainability screening of engineering projects
Comparative analysis of product designs
Educational tool for life cycle thinking
Sensitivity testing for carbon intensity scenarios
Supporting LEED, Envision, or ISO 14040/44 assessments
References#
ISO 14040: Environmental Management — Life Cycle Assessment
U.S. EPA Life Cycle Assessment Framework
GHG Protocol Product Life Cycle Accounting and Reporting Standard
2. Simulation#
import numpy as np
import matplotlib.pyplot as plt
import ipywidgets as widgets
from IPython.display import display, clear_output

# 📦 Default impact factors per stage (per unit)
impact_factors = {
    "Production": {"GWP": 100, "Water": 5, "Energy": 800},
    "Transport": {"GWP": 20, "Water": 1, "Energy": 100},
    "Operation": {"GWP": 50, "Water": 3, "Energy": 500},
    "End-of-Life": {"GWP": 30, "Water": 2, "Energy": 200}
}

# 🔁 System multipliers
system_multipliers = {
    "Infrastructure": 1.0,
    "Consumer Product": 0.6,
    "Energy System": 1.2,
    "Water Treatment": 1.1
}

# 🌿 Main LCA evaluation function
def evaluate_lca(units, system_type, carbon_intensity, show_plot):
    clear_output(wait=True)

    multiplier = system_multipliers[system_type]
    stages = list(impact_factors.keys())
    gwp = []
    water = []
    energy = []
    carbon_footprint = []

    for stage in stages:
        gwp_val = units * impact_factors[stage]["GWP"] * multiplier
        water_val = units * impact_factors[stage]["Water"] * multiplier
        energy_val = units * impact_factors[stage]["Energy"] * multiplier
        carbon_val = energy_val * carbon_intensity

        gwp.append(gwp_val)
        water.append(water_val)
        energy.append(energy_val)
        carbon_footprint.append(carbon_val)

    # 📊 Plot results
    if show_plot:
        x = np.arange(len(stages))
        width = 0.2

        plt.figure(figsize=(10, 6))
        plt.bar(x - 1.5*width, gwp, width, label="GWP (kg CO₂-eq)", color="tomato")
        plt.bar(x - 0.5*width, water, width, label="Water Use (m³)", color="skyblue")
        plt.bar(x + 0.5*width, energy, width, label="Energy (MJ)", color="goldenrod")
        plt.bar(x + 1.5*width, carbon_footprint, width, label="Carbon Footprint (kg CO₂)", color="gray")
        plt.xticks(x, stages)
        plt.ylabel("Impact per Stage")
        plt.title(f"LCA Impact Evaluation — {system_type} ({units} units)")
        plt.legend()
        plt.grid(True)
        plt.tight_layout()
        plt.show()

    # 📋 Summary
    print(f"🔎 Total Impacts for {units} units of {system_type}:")
    print(f"🌍 GWP: {sum(gwp):.1f} kg CO₂-eq")
    print(f"💧 Water Use: {sum(water):.1f} m³")
    print(f"⚡ Energy Consumption: {sum(energy):.1f} MJ")
    print(f"🧮 Carbon Footprint (based on energy): {sum(carbon_footprint):.1f} kg CO₂")

# 🎛️ Interactive controls
units_slider = widgets.FloatSlider(value=10, min=1, max=100, step=1, description='Units')
system_dropdown = widgets.Dropdown(options=list(system_multipliers.keys()), value="Infrastructure", description='System Type')
carbon_slider = widgets.FloatSlider(value=0.25, min=0.1, max=1.0, step=0.05, description='CO₂/MJ')
plot_toggle = widgets.Checkbox(value=True, description='Show Plot')

interactive_lca = widgets.interactive(
    evaluate_lca,
    units=units_slider,
    system_type=system_dropdown,
    carbon_intensity=carbon_slider,
    show_plot=plot_toggle
)

display(interactive_lca)
3. Self-Assessment#
📘 Conceptual Questions#
These questions explore the modeling logic, assumptions, and physical meaning behind the LCA simulation.
Life Cycle Stages#
What are the four stages considered in this LCA model, and why are they important?
How do impact factors (GWP, water, energy) vary across life cycle stages?
Why is energy use converted to carbon footprint using a carbon intensity factor?
System Multipliers#
What does a system multiplier represent in the context of LCA?
How does changing the system type (e.g., infrastructure vs. consumer product) affect total impacts?
Why might an energy system have a higher multiplier than a consumer product?
Visualization & Interpretation#
What insights can be gained from comparing GWP, water use, energy, and carbon footprint across stages?
Why is it useful to visualize impacts per stage rather than just total values?
How could this model be adapted to include additional impact categories (e.g., land use, toxicity)?
Reflective Questions#
These questions encourage critical thinking and application to real-world sustainability decisions.
Which life cycle stage contributes most to the carbon footprint in your selected system, and why?
How would the results change if the carbon intensity of energy were reduced through renewables?
What are the trade-offs between reducing energy use and minimizing water consumption?
How could this model support product design or infrastructure planning for lower environmental impact?
What limitations exist in using fixed impact factors and multipliers for diverse real-world systems?
❓ Quiz Questions#
Multiple Choice#
Which stage typically has the highest energy consumption in most systems?
A. Production
B. Transport
C. Operation
D. End-of-Life
Answer: CIf a system uses 500 MJ of energy and the carbon intensity is 0.25 kg CO₂/MJ, what is the carbon footprint?
A. 125 kg CO₂
B. 250 kg CO₂
C. 500 kg CO₂
D. 1000 kg CO₂
Answer: BWhat does the system multiplier affect in the model?
A. Only water use
B. Only carbon footprint
C. All impact categories proportionally
D. Only production stage
Answer: C
True/False#
The model assumes impact factors are constant per unit across all systems.
Answer: TrueCarbon footprint is calculated directly from GWP values.
Answer: FalseChanging the number of units affects all impact categories linearly.
Answer: True
Short Answer#
Explain how the model calculates carbon footprint from energy consumption.
Answer: It multiplies the energy used in each stage by the carbon intensity factor (kg CO₂/MJ).Why might the operation stage dominate the total impact for an energy system?
Answer: Because energy systems often have high ongoing energy use, which drives both energy consumption and carbon emissions.


