
Chapter 4 Geotechnical Engineering: USCS Soil Classification#
1. Introduction#
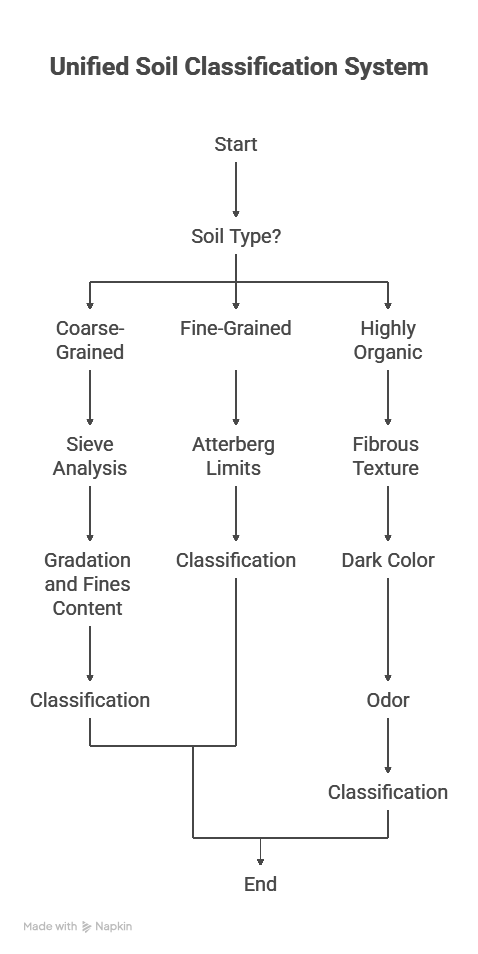
Fig. 14 **Figure 4.0 **: Soil Classification.#
🧱 Soil and Sand Classification – Engineering and Coastal Importance#
Soil classification is the process of categorizing soils based on their grain size, plasticity, and behavior under loading and environmental conditions. It helps engineers predict performance and select appropriate design strategies.
📊 Common Soil Classification Systems#
System |
Basis of Classification |
Typical Use Case |
|---|---|---|
USCS |
Grain size, plasticity, and Atterberg limits |
Foundation and earthwork design |
AASHTO |
Grain size and fines content |
Highway and pavement design |
Unified Soil Classification |
Combines textural and plasticity criteria |
General geotechnical applications |
🌊 Sand Classification in Coastal Engineering#
In coastal engineering, sand is classified based on grain size to evaluate its suitability for:
Beach nourishment
Dune stabilization
Scour protection
Sediment transport modeling
📐 Coastal Sand Size Categories#
Sand Type |
Grain Size Range (mm) |
Description |
|---|---|---|
Very Fine Sand |
0.0625 – 0.125 |
Easily eroded; low settling velocity |
Fine Sand |
0.125 – 0.25 |
Common in beach profiles |
Medium Sand |
0.25 – 0.5 |
Stable under moderate wave action |
Coarse Sand |
0.5 – 1.0 |
Used for dune and berm construction |
Very Coarse Sand |
1.0 – 2.0 |
High resistance to wave-induced transport |
Grain size affects wave energy dissipation, sediment mobility, and beach profile evolution.
🧠 Importance of Soil Classification in Engineering#
1. Foundation Design#
Determines bearing capacity and settlement behavior
2. Slope Stability#
Identifies risk-prone soils (e.g., soft clays, loose sands)
3. Compaction and Earthwork#
Guides equipment selection and moisture control
4. Drainage and Permeability#
Influences seepage, erosion, and groundwater flow
5. Construction Suitability#
Flags problematic soils (e.g., expansive, collapsible, organic)
6. Coastal Applications#
Supports sediment transport modeling, beach nourishment, and erosion control
📐 Key Soil Properties for Classification#
Property |
Role in Classification |
|---|---|
Grain Size |
Distinguishes coarse vs. fine soils; critical in coastal and geotechnical design |
Plasticity Index |
Indicates soil’s ability to deform without cracking |
Liquid and Plastic Limits |
Define consistency and moisture sensitivity |
Fines Content |
Affects permeability, cohesion, and compaction |
🧠 Conceptual Insight#
Soil and sand classification are essential for predicting behavior,
ensuring safe design, and managing environmental interactions —
from foundations to shorelines.
References#
[Das, 2010] provides a clear and structured explanation of liquid limit, plastic limit, and plasticity index, collectively known as the Atterberg limits. These are essential for classifying fine-grained soils and predicting their engineering behavior. The standard test procedures for determining Atterberg limits—including liquid limit, plastic limit, and plasticity index—are described in detail in [ASTM International, 2017].
2. Simulation#
USCS Soil Classification Tool – Description & Theory#
This interactive tool classifies soil based on the Unified Soil Classification System (USCS) and visualizes its plasticity characteristics using the Casagrande Plasticity Chart. It is designed for geotechnical engineers, students, and researchers to explore soil behavior based on key parameters.
USCS Classification Theory#
The USCS classifies soils based on:
Grain size distribution (percent fines, sand, gravel)
Plasticity characteristics (Liquid Limit and Plasticity Index)
🔹 Key Definitions:#
Fines: Particles smaller than 0.075 mm (silt and clay)
Sand: Particles between 0.075 mm and 4.75 mm
Gravel: Particles larger than 4.75 mm
Liquid Limit (LL): Water content at which soil changes from plastic to liquid state
Plasticity Index (PI): PI = LL - PL (Plastic Limit)
Casagrande Plasticity Chart#
This chart is used to classify fine-grained soils based on LL and PI.
A-line: PI = 0.73(LL - 20)
Soils above the A-line are clays
Soils below the A-line are silts
U-line: PI = 0.9(LL - 8)
Represents the upper bound of natural soil behavior
Code Functionality#
1. Input Sliders#
Users input:
Percent Fines
Percent Sand
Percent Gravel
Liquid Limit (LL)
Plasticity Index (PI)
2. Classification Logic#
If fines > 50%:
CH: Fat Clay (PI > A-line)
ML: Silt (PI < A-line)
CL-ML: Intermediate
If 12% < fines ≤ 50%:
SC/SM: Silty or Clayey Sand
If sand > gravel:
SP/SM: Poorly Graded or Silty Sand
Else:
GP/GM: Poorly Graded or Silty Gravel
3. Plasticity Chart#
Plots A-line, U-line, and the sample point
Helps visualize soil behavior and classification
How to Use#
Adjust the sliders to input soil parameters.
View the USCS classification and plasticity chart update in real time.
This tool is ideal for educational use, lab data interpretation, and preliminary geotechnical analysis.
import ipywidgets as widgets
from IPython.display import display, Markdown
import plotly.graph_objects as go

def classify_soil(percent_fines, percent_sand, percent_gravel, LL, PI):
    if percent_fines > 50:
        if PI > 7 and PI > 0.73 * (LL - 20):
            return "CH (Fat Clay)"
        elif PI < 4 and PI < 0.73 * (LL - 20):
            return "ML (Silt)"
        else:
            return "CL-ML (Silty Clay)"
    elif percent_fines > 12:
        return "SC/SM (Silty or Clayey Sand)"
    elif percent_sand > percent_gravel:
        return "SP/SM (Poorly Graded or Silty Sand)"
    else:
        return "GP/GM (Poorly Graded or Silty Gravel)"


def plot_plasticity_chart(LL, PI):
    fig = go.Figure()

    # A-line
    x_a = list(range(0, 101))
    y_a = [0.73 * (x - 20) for x in x_a]
    fig.add_trace(go.Scatter(x=x_a, y=y_a, mode='lines', name='A-line'))

    # U-line
    x_u = list(range(8, 74))
    y_u = [0.9 * x - 8 for x in x_u]
    fig.add_trace(go.Scatter(x=x_u, y=y_u, mode='lines', name='U-line'))

    # Sample point
    fig.add_trace(go.Scatter(x=[LL], y=[PI], mode='markers', name='Sample', marker=dict(size=10, color='red')))

    fig.update_layout(title='Casagrande Plasticity Chart',
                      xaxis_title='Liquid Limit (LL)',
                      yaxis_title='Plasticity Index (PI)',
                      xaxis=dict(range=[0, 100]),
                      yaxis=dict(range=[0, 60]),
                      width=700, height=500)
    fig.show()


percent_fines = widgets.IntSlider(value=30, min=0, max=100, description='Fines (%)')
percent_sand = widgets.IntSlider(value=40, min=0, max=100, description='Sand (%)')
percent_gravel = widgets.IntSlider(value=30, min=0, max=100, description='Gravel (%)')
LL = widgets.IntSlider(value=40, min=0, max=100, description='Liquid Limit')
PI = widgets.IntSlider(value=20, min=0, max=60, description='Plasticity Index')

ui = widgets.VBox([percent_fines, percent_sand, percent_gravel, LL, PI])


out = widgets.Output()

def update(change=None):
    out.clear_output()
    with out:
        classification = classify_soil(percent_fines.value, percent_sand.value, percent_gravel.value, LL.value, PI.value)
        display(Markdown(f"### USCS Classification: **{classification}**"))
        plot_plasticity_chart(LL.value, PI.value)

for widget in [percent_fines, percent_sand, percent_gravel, LL, PI]:
    widget.observe(update, names='value')

display(ui, out)
update()
3. Simulation#
🧱 Interactive Soil Texture and Property Estimator#
This tool:
Classifies soil texture using USDA soil triangle rules
Automatically calculates silt percentage from user-selected sand and clay
Estimates key hydraulic and geotechnical properties:
Field Capacity (θ_fc)
Wilting Point (θ_wp)
Saturated Hydraulic Conductivity (Ksat)
Soil Strength
Compression Index (Cc)
Recompression Index (Cr)
🔧 Inputs#
Sand (%): User-selected via slider
Clay (%): User-selected via slider (auto-constrained so sand + clay ≤ 100%)
Silt (%): Automatically computed as
100 − sand − clay
📐 Classification#
Applies USDA soil texture rules to determine texture class:
Examples: Loam, Clay Loam, Sandy Clay, Silt Loam
📊 Property Estimation#
Retrieves hydraulic and geotechnical properties from a predefined database based on texture class
📋 How to Interpret Results#
Output Field |
Meaning |
|---|---|
Soil Texture Classification |
USDA-based label (e.g., Loam, Clay, Sandy Loam) |
Sand / Clay / Silt (%) |
Composition breakdown; silt is auto-calculated |
θ_fc / θ_wp |
Water retention characteristics; important for irrigation and drainage |
Ksat (mm/hr) |
Saturated hydraulic conductivity; affects infiltration and seepage |
Soil Strength (kPa) |
Approximate shear strength; relevant for bearing capacity and stability |
Cc / Cr |
Compression and recompression indices; used in settlement analysis |
🧠 Conceptual Insight#
This tool supports soil classification and preliminary design by linking texture to key engineering properties —
useful for foundation design, drainage planning, and agronomic assessments.
❓ Example Questions#
What happens to silt percentage when sand and clay are increased?
How does soil texture affect hydraulic conductivity?
Why is compression index important in geotechnical design?
What texture class typically has the highest field capacity?
How does this tool help in estimating soil behavior for foundations?
import numpy as np
import ipywidgets as widgets
from IPython.display import display, Markdown, clear_output

# 📌 Soil texture database with hydraulic and geotechnical properties
soil_texture_db = {
    'Sand': {'θ_fc': 0.10, 'θ_wp': 0.05, 'Ksat': 100.0, 'strength': 10, 'Cc': 0.01, 'Cr': 0.005},
    'Loamy Sand': {'θ_fc': 0.12, 'θ_wp': 0.06, 'Ksat': 40.0, 'strength': 15, 'Cc': 0.02, 'Cr': 0.007},
    'Sandy Loam': {'θ_fc': 0.18, 'θ_wp': 0.10, 'Ksat': 20.0, 'strength': 20, 'Cc': 0.05, 'Cr': 0.015},
    'Loam': {'θ_fc': 0.25, 'θ_wp': 0.12, 'Ksat': 10.0, 'strength': 25, 'Cc': 0.10, 'Cr': 0.03},
    'Silt Loam': {'θ_fc': 0.30, 'θ_wp': 0.15, 'Ksat': 6.0, 'strength': 30, 'Cc': 0.15, 'Cr': 0.05},
    'Sandy Clay Loam': {'θ_fc': 0.27, 'θ_wp': 0.17, 'Ksat': 2.0, 'strength': 40, 'Cc': 0.20, 'Cr': 0.07},
    'Clay Loam': {'θ_fc': 0.32, 'θ_wp': 0.20, 'Ksat': 1.0, 'strength': 50, 'Cc': 0.25, 'Cr': 0.08},
    'Silty Clay Loam': {'θ_fc': 0.34, 'θ_wp': 0.22, 'Ksat': 0.5, 'strength': 60, 'Cc': 0.30, 'Cr': 0.10},
    'Sandy Clay': {'θ_fc': 0.30, 'θ_wp': 0.20, 'Ksat': 1.0, 'strength': 55, 'Cc': 0.28, 'Cr': 0.09},
    'Silty Clay': {'θ_fc': 0.36, 'θ_wp': 0.25, 'Ksat': 0.3, 'strength': 65, 'Cc': 0.35, 'Cr': 0.12},
    'Clay': {'θ_fc': 0.40, 'θ_wp': 0.27, 'Ksat': 0.1, 'strength': 70, 'Cc': 0.40, 'Cr': 0.15}
}

# 📐 USDA soil texture classifier
def classify_soil_texture(sand, silt, clay):
    if sand + silt + clay != 100:
        return "Invalid: Percentages must sum to 100"

    if clay >= 40:
        if silt >= 40:
            return 'Silty Clay'
        elif sand >= 45:
            return 'Sandy Clay'
        else:
            return 'Clay'
    elif clay >= 27:
        if sand >= 20 and sand <= 45:
            return 'Clay Loam'
        elif silt >= 28 and silt < 50:
            return 'Silty Clay Loam'
        else:
            return 'Sandy Clay Loam'
    elif clay >= 7 and clay < 27:
        if silt >= 50 and sand < 20:
            return 'Silt Loam'
        elif silt >= 30 and silt < 50 and sand >= 20 and sand < 50:
            return 'Loam'
        elif silt < 28 and sand >= 50:
            return 'Sandy Loam'
        else:
            return 'Clay Loam'
    elif clay < 7:
        if silt < 50 and sand > 85:
            return 'Sand'
        elif sand >= 70 and silt >= 15 and silt < 30:
            return 'Loamy Sand'
        else:
            return 'Sandy Loam'
    else:
        return 'Loam'

# 🔍 Property estimator
def estimate_properties(sand, clay):
    silt = 100 - sand - clay
    if silt < 0:
        return "Invalid", None, silt
    texture = classify_soil_texture(sand, silt, clay)
    props = soil_texture_db.get(texture, None)
    return texture, props, silt

# 🎛️ Interactive widgets
sand_slider = widgets.IntSlider(value=60, min=0, max=100, step=1, description='Sand (%)')
clay_slider = widgets.IntSlider(value=20, min=0, max=40, step=1, description='Clay (%)')
output = widgets.Output()

def update_clay_slider_range(change=None):
    clay_slider.max = 100 - sand_slider.value
    if clay_slider.value > clay_slider.max:
        clay_slider.value = clay_slider.max

def update_output(change=None):
    output.clear_output()
    sand = sand_slider.value
    clay = clay_slider.value
    texture, props, silt = estimate_properties(sand, clay)
    with output:
        if silt < 0:
            display(Markdown("❌ **Error:** Sand + Clay must be ≤ 100%"))
            return
        display(Markdown(f"### 🧱 Soil Texture Classification: **{texture}**"))
        display(Markdown(f"- **Sand:** {sand}%  \n- **Clay:** {clay}%  \n- **Silt (auto):** {silt}%"))
        if props:
            display(Markdown(f"""
- **Field Capacity (θ_fc):** {props['θ_fc']:.2f}
- **Wilting Point (θ_wp):** {props['θ_wp']:.2f}
- **Saturated Hydraulic Conductivity (Ksat):** {props['Ksat']:.2f} mm/hr
- **Soil Strength:** {props['strength']} kPa
- **Compression Index (Cc):** {props['Cc']:.2f}
- **Recompression Index (Cr):** {props['Cr']:.2f}
"""))
        else:
            display(Markdown("⚠️ No data available for this texture."))

# 🔄 Link updates
sand_slider.observe(update_clay_slider_range, names='value')
sand_slider.observe(update_output, names='value')
clay_slider.observe(update_output, names='value')

# 📊 Display interface
display(widgets.VBox([sand_slider, clay_slider]), output)
update_clay_slider_range()
update_output()
4. Self-Assessment#
USCS Soil Classification Learning Module#
1. Conceptual Questions#
What is the Unified Soil Classification System (USCS), and why is it important in geotechnical engineering?
Define the terms: Liquid Limit (LL), Plastic Limit (PL), and Plasticity Index (PI).
What is the significance of the A-line in the Casagrande Plasticity Chart?
How does the percentage of fines influence whether a soil is classified as coarse-grained or fine-grained?
What are the typical engineering behaviors of CH vs. ML soils?
2. Reflective Questions#
How might the classification of a soil change if the fines content increases from 10% to 60%?
Why might two soils with the same LL but different PI values be classified differently?
How does the USCS classification help in selecting foundation types or construction methods?
What limitations might exist in using only LL and PI for soil classification?
How would you explain the difference between SC and SM soils to a non-engineer?
3. Sample Problems#
Problem 1:#
A soil sample has:
Fines: 55%
LL: 60
PI: 35
Question: What is the USCS classification?
✅ Answer: Since fines > 50% and PI > A-line → CH (Fat Clay)
Problem 2:#
A soil has:
Fines: 15%
Sand: 60%
Gravel: 25%
LL: 45
PI: 10
Question: What is the USCS classification?
✅ Answer: Fines between 12–50% → SC/SM (Silty or Clayey Sand)
Problem 3:#
A soil has:
Fines: 8%
Sand: 30%
Gravel: 62%
Question: What is the USCS classification?
✅ Answer: Fines < 12%, gravel > sand → GP/GM (Poorly Graded or Silty Gravel)
📝 4. Quiz (Multiple Choice)#
from IPython.display import clear_output

def create_quiz(question, options, correct_index):
    radio = widgets.RadioButtons(options=options, description='', layout={'width': 'max-content'})
    output = widgets.Output()

    def check_answer(change):
        output.clear_output()
        with output:
            if radio.index == correct_index:
                print("✅ Correct!")
            else:
                print("❌ Incorrect. Try again!")

    radio.observe(check_answer, names='value')
    display(Markdown(question), radio, output)

create_quiz("**Q1.** What does the A-line on the plasticity chart represent?",
            ["A) Boundary between sand and gravel", "B) Upper limit of plasticity", "C) Boundary between clays and silts", "D) Liquid limit threshold"], 2)

create_quiz("**Q2.** A soil with LL = 50 and PI = 10 lies:",
            ["A) Above the A-line", "B) Below the A-line", "C) On the U-line", "D) Cannot be determined"], 1)

create_quiz("**Q3.** Which of the following is a coarse-grained soil?",
            ["A) CH", "B) ML", "C) SP", "D) CL"], 2)
Q1. What does the A-line on the plasticity chart represent?
Q2. A soil with LL = 50 and PI = 10 lies:
Q3. Which of the following is a coarse-grained soil?