
Chapter 6 Geotech Engineering Laboratory: Liquid and Plastic Limit#
1. Introduction#
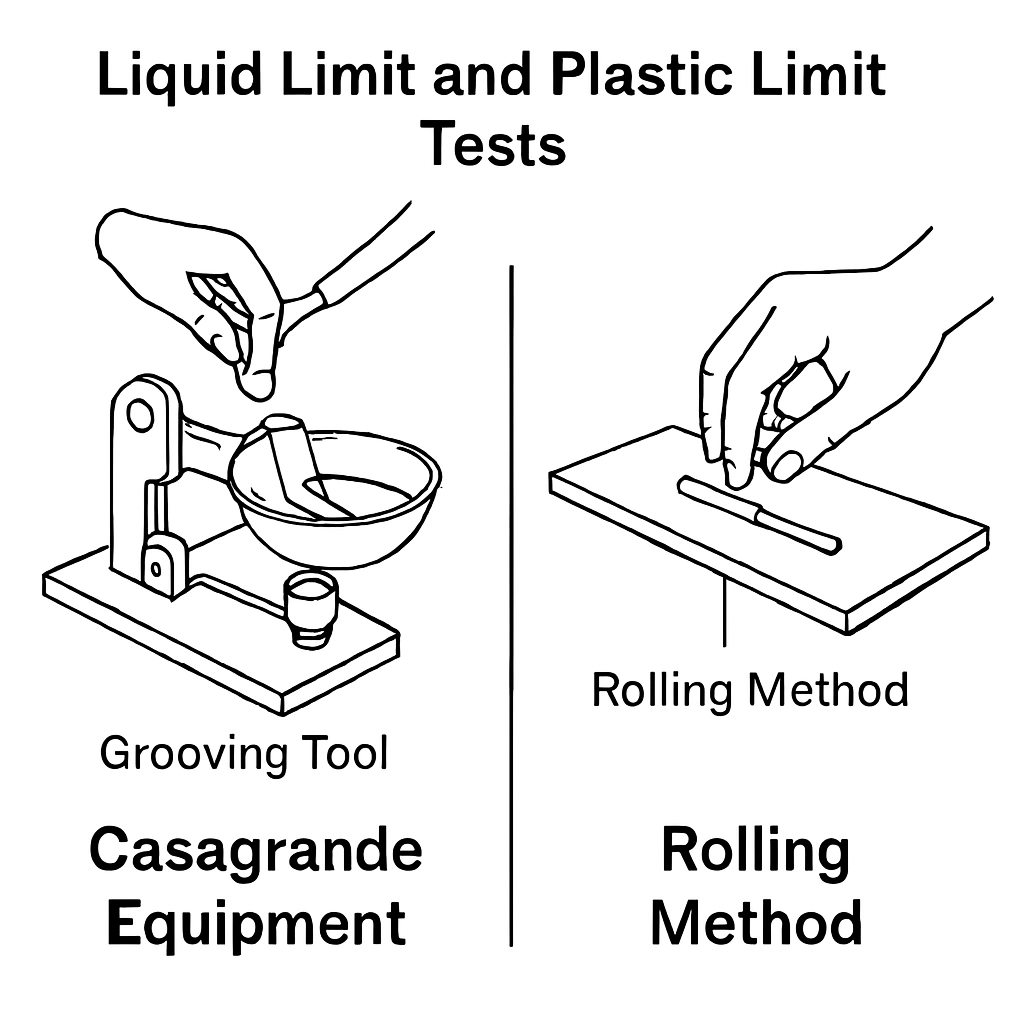
Fig. 16 **Figure 4.2 **: Liquid and Plastic Limit for fine-grained soil.#
🧪 Liquid Limit & Plastic Limit – Definitions, Importance & Empirical Use#
📘 Definitions#
Term |
Description |
|---|---|
Liquid Limit (LL) |
Moisture content (%) at which soil transitions from plastic to liquid behavior |
Plastic Limit (PL) |
Moisture content (%) at which soil transitions from semi-solid to plastic state |
Plasticity Index (PI) |
Difference between LL and PL → ( PI = LL - PL ) |
🎯 Importance in Geotechnical Engineering#
Parameter |
Influence of Atterberg Limits |
|---|---|
Soil Classification |
PI and LL define fine-grained behavior (USCS, AASHTO systems) |
Workability |
Determines ease of handling, compaction, and mixing |
Settlement & Compressibility |
High PI → greater compressibility in saturated soils |
Foundation Design |
LL used in estimating undrained shear strength and bearing capacity |
Expansive Behavior |
High PI indicates swelling potential for clays |
🧭 U.S. Standards for Measurement#
Property |
Method |
ASTM Standard |
|---|---|---|
Liquid Limit |
Casagrande Groove Closure (mechanical device) |
ASTM D4318 |
Plastic Limit |
Soil thread rolling until crumbling |
ASTM D4318 |
PI Calculation |
( PI = LL - PL ) |
ASTM D4318 |
🔹 LL is determined by plotting moisture vs. groove closure blows and estimating at 25 blows (log regression).
🔹 PL is taken as the average moisture content at which rolled soil threads begin to crumble at 3.2 mm diameter.
📐 Empirical Equations Using LL, PL, PI#
✅ Compression / Settlement#
Equation |
Expression |
Source |
|---|---|---|
Compression Index (Cc) |
\(( C_c = 0.009 (LL - 10) \)) |
Terzaghi & Peck |
Secondary Compression (Cα) |
\(( C_\alpha = C_c / (1 + e_0) \)) |
Consolidation Theory |
✅ Shear Strength / Bearing Capacity#
Equation |
Expression |
Use Case |
|---|---|---|
Undrained Shear Strength (Su) |
\(( Su = A \cdot PI^{-0.5} \cdot \sigma_v \)) |
Soft clays |
Bearing Capacity Reduction |
\(( q_{ult} = B - C \cdot PI \)) |
Shallow foundations |
✅ Permeability / Hydraulic Conductivity#
Equation |
Expression |
Notes |
|---|---|---|
Seed et al. (1961) |
\(( K = 10^{-7 + 3.3 \cdot PI/LL} \)) |
Fine soils |
Ferguson & Maxwell |
\(( \log(K) = A - B \cdot LL \)) |
Empirical estimate |
Morin & Todorovic |
\(( K = a \cdot e^b \cdot LL^{-c} \)) |
Silty clays |
🧭 Interpretation Notes#
High LL (>50%) → Soil may exhibit soft, liquid behavior; careful handling needed
High PI (>20%) → Swelling, shrinkage, and stability concerns in foundations
Empirical formulas help estimate soil behavior when lab tests aren’t available, but must be used cautiously—always validate when possible
References#
[Das, 2010] provides a clear and structured explanation of liquid limit, plastic limit, and plasticity index, collectively known as the Atterberg limits. These are essential for classifying fine-grained soils and predicting their engineering behavior. The standard test procedures for determining Atterberg limits—including liquid limit, plastic limit, and plasticity index—are described in detail in [ASTM International, 2017].
2. Simulation#
🧪 Atterberg Limit Calculator – Summary Guide#
An interactive Python tool using ipywidgets to compute the Liquid Limit (LL), Plastic Limit (PL), and Plasticity Index (PI) based on laboratory moisture content measurements.
LL estimated from Casagrande groove closure trials (moisture vs. blow count)
PL averaged from plastic thread moisture trials
PI computed as LL − PL, indicating soil plasticity behavior
⚙️ What It Does#
Task |
Method Used |
|---|---|
Input data for LL (moisture & blows) |
User-entered values per trial |
Input data for PL (moisture only) |
Averaged across trials |
Compute LL |
Regression at 25 blows (log-linear fit) |
Compute PL |
Mean moisture from plastic thread trials |
Output PI |
LL − PL |
Output Classification |
Based on PI value range (low, med, high) |
🧩 How to Use#
📥 Inputs#
LL trials: moisture content (%) and closure blows per test
PL trials: moisture content from rolling soil into threads
📤 Outputs#
Output |
Meaning |
|---|---|
LL (%) |
Water content where clay flows under vibration |
PL (%) |
Water content at which soil crumbles when rolled |
PI (%) |
Index of soil plasticity (LL − PL) |
Classification |
Soil behavior: low, medium, or high plasticity |
🧭 How to Interpret#
PI Value |
Plasticity Class |
Soil Implication |
|---|---|---|
PI < 7 |
💡 Low plasticity |
Easily workable, minimal swelling |
PI 7–20 |
💡 Medium plasticity |
Moderate volume change & handling effort |
PI > 20 |
💡 High plasticity |
Sticky, expansive behavior risk |
Use these limits for soil classification under systems like USCS and for selecting compaction, stabilization, and foundation methods.
import pandas as pd
import numpy as np
import ipywidgets as widgets
from IPython.display import display, Markdown
import math

# 💡 Styling
style = {'description_width': '200px'}
layout = widgets.Layout(width='400px')

# 📋 Liquid Limit Data Entry
num_ll_trials = widgets.IntSlider(value=4, min=2, max=6, description='LL Trials:', style=style, layout=layout)

def create_ll_inputs(n):
    return [
        (
            widgets.FloatText(value=28 + i*2, description=f'Trial {i+1} – Moisture (%)', style=style, layout=layout),
            widgets.IntText(value=15 + i*5, description=f'Trial {i+1} – Blows', style=style, layout=layout)
        )
        for i in range(n)
    ]

ll_data = create_ll_inputs(num_ll_trials.value)

def update_ll(change):
    global ll_data
    ll_data = create_ll_inputs(change['new'])
    ll_box.children = [w for group in ll_data for w in group]

num_ll_trials.observe(update_ll, names='value')
ll_box = widgets.VBox([w for group in ll_data for w in group])

# 📋 Plastic Limit Data Entry
num_pl_trials = widgets.IntSlider(value=3, min=1, max=5, description='PL Trials:', style=style, layout=layout)

pl_inputs = [
    widgets.FloatText(value=19 + i, description=f'PL Moisture (%) T{i+1}', style=style, layout=layout)
    for i in range(num_pl_trials.value)
]

def update_pl(change):
    global pl_inputs
    pl_inputs = [widgets.FloatText(value=19 + i, description=f'PL Moisture (%) T{i+1}', style=style, layout=layout)
                 for i in range(change['new'])]
    pl_box.children = pl_inputs

num_pl_trials.observe(update_pl, names='value')
pl_box = widgets.VBox(pl_inputs)

# 🧮 Calculation
run_btn = widgets.Button(description='Compute LL, PL & PI', layout=widgets.Layout(width='300px'))

def on_run_click(b):
    # LL Regression
    blows = []
    moistures = []
    for m, n in ll_data:
        moistures.append(m.value)
        blows.append(n.value)

    log_blows = [math.log10(x) for x in blows]
    df_ll = pd.DataFrame({'Moisture': moistures, 'Log(Blows)': log_blows})
    slope, intercept = np.polyfit(df_ll['Log(Blows)'], df_ll['Moisture'], 1)
    LL = round(slope * math.log10(25) + intercept, 1)

    # PL Average
    pl_vals = [x.value for x in pl_inputs if x.value > 0]
    PL = round(np.mean(pl_vals), 1)
    PI = round(LL - PL, 1)

    # Classification Hint
    if PI < 7:
        desc = "💡 Low plasticity"
    elif PI < 20:
        desc = "💡 Intermediate plasticity"
    else:
        desc = "💡 High plasticity"

    md = f"""
### 🧪 Atterberg Limit Results

- **Liquid Limit (LL)**: {LL:.1f} %
- **Plastic Limit (PL)**: {PL:.1f} %
- **Plasticity Index (PI)**: {PI:.1f} %
- **Estimated Classification**: {desc}

---

### 📐 Interpretation Notes
- LL estimated via regression at 25 blows (Casagrande method)
- PL taken as average of plastic roll moisture
- PI = LL - PL → Indicator of soil plasticity and classification
"""
    display(Markdown(md))

run_btn.on_click(on_run_click)

# 🧩 Display Interface
display(widgets.VBox([
    widgets.HTML("<h3>💧 Liquid Limit Inputs (Casagrande)</h3>"),
    num_ll_trials, ll_box,
    widgets.HTML("<h3>🧂 Plastic Limit Inputs (Roll Method)</h3>"),
    num_pl_trials, pl_box,
    run_btn
]))
3. Self-Assessment#
🧪 Atterberg Limits – Conceptual, Reflective & Quiz Questions#
🔍 Conceptual Questions#
What does the liquid limit (LL) represent in terms of soil behavior?
How does the plastic limit (PL) relate to the consistency and workability of fine-grained soils?
Why is plasticity index (PI) a useful metric in geotechnical soil classification?
How does moisture content influence the transition between liquid, plastic, and semi-solid states in clayey soils?
What are the limitations of using Casagrande’s groove method for determining LL?
💭 Reflective Questions#
In your lab trial, what factors influenced variability in LL and PL measurements?
How would soil plasticity affect field handling, compaction, or foundation preparation?
If two soils have similar LL but very different PI, how might that influence your design decisions?
What human or procedural errors could bias the moisture content used in calculating Atterberg limits?
How do Atterberg limits help in understanding swelling potential or shrinkage behavior?
🧪 Quiz Questions#
Theory & Classification#
Q1. Plasticity Index (PI) is calculated as:
A. PI = PL − LL
B. PI = LL × PL
C. PI = LL − PL ✅
D. PI = LL / PL
Q2. A soil with LL = 50% and PL = 22% has:
A. PI = 28% ✅
B. PI = 72%
C. PI = 32%
D. PI = 4%
Q3. Which statement best describes a high PI soil?
A. Very brittle and non-plastic
B. Highly plastic and expansive ✅
C. Low moisture retention
D. Ideal for road subgrade
Methodology#
Q4. Casagrande method uses which feature to determine LL?
A. Soil roll stiffness
B. Closure of groove at 25 blows ✅
C. Drop cone penetration
D. Weight of sample
Q5. Atterberg limits apply to which soil fraction?
A. Coarse gravel
B. Sand
C. Silt and clay-sized particles ✅
D. Organic topsoil