
Chapter 3 Hydraulics: Storm Drain Inet Design#
1. Introduction#
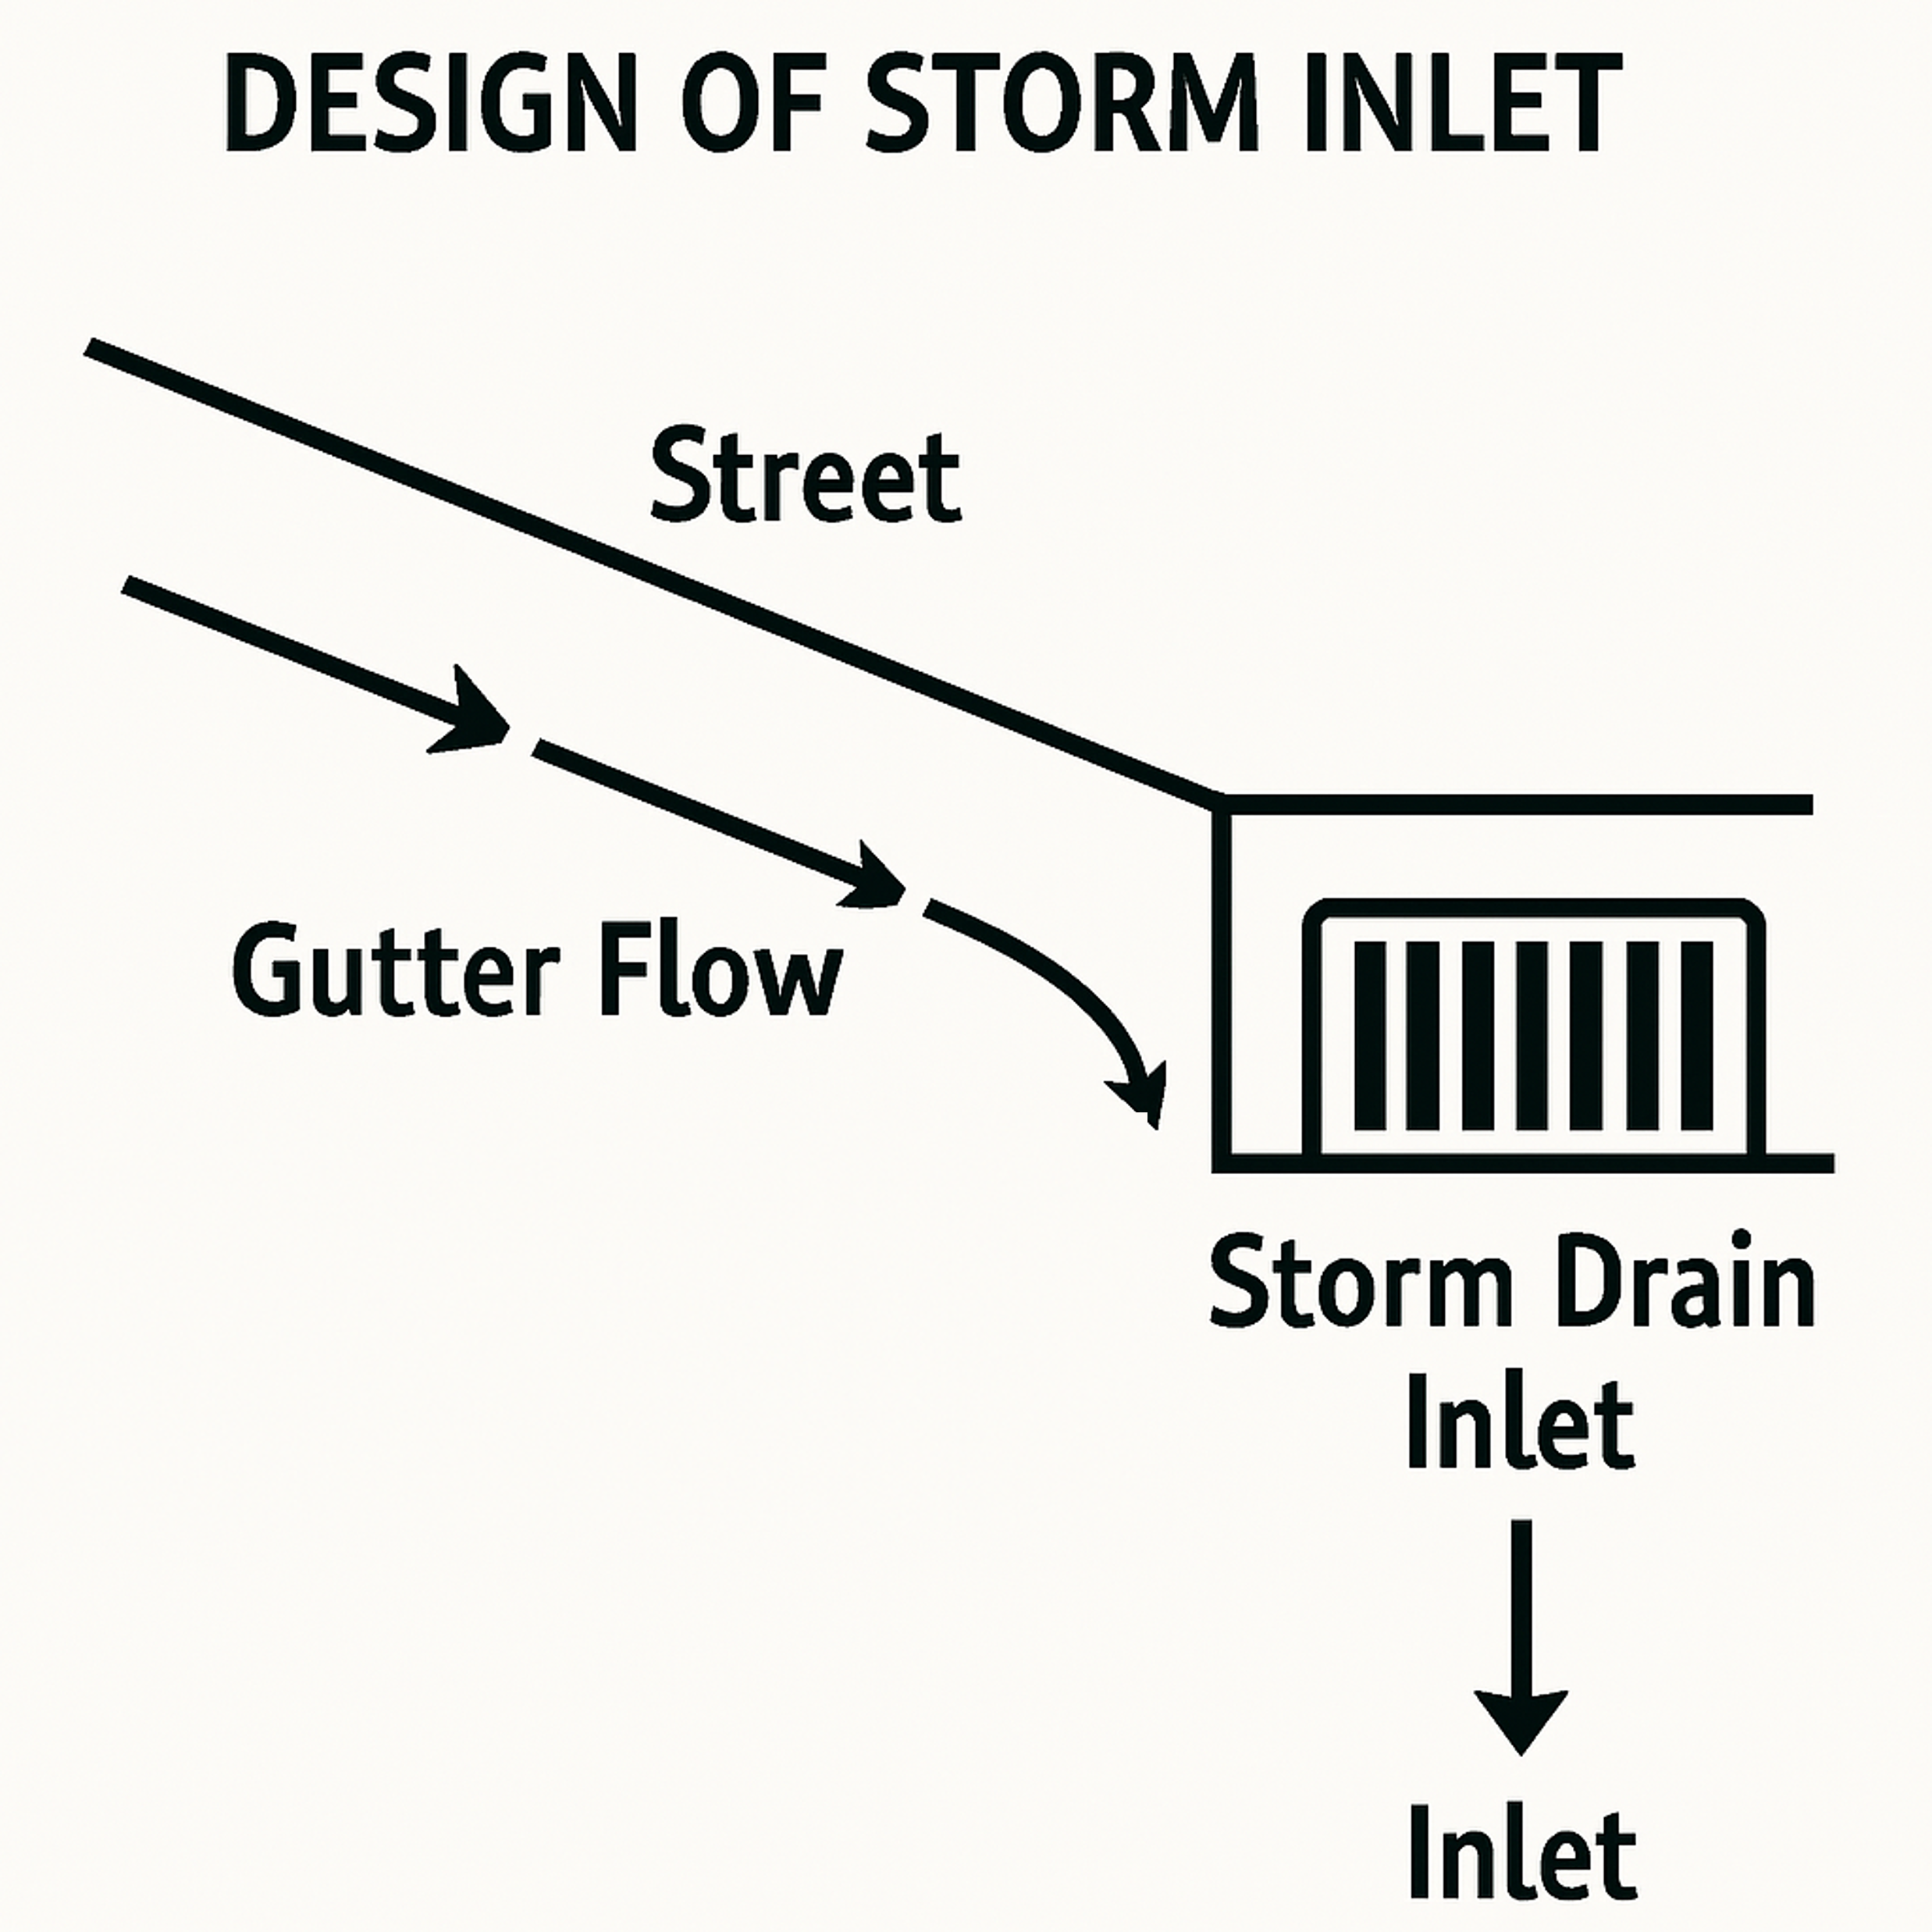
Fig. 10 **Figure 3.10 **: Design of Stormwater Inlet.#
📐 Urban system#
Urban areas are highly impervious due to roads, rooftops, and pavements, which prevent natural infiltration and increase surface runoff. Stormwater systems are essential to:
Prevent Urban Flooding: Rapid runoff can overwhelm streets and infrastructure
Protect Public Safety: Reduces risk of property damage, traffic disruption, and health hazards
Maintain Water Quality: Filters pollutants before discharge to natural water bodies
Support Sustainable Development: Integrates with green infrastructure and climate resilience
Comply with Regulations: Meets municipal, state, and federal stormwater management standards
📐 Design Philosophy#
Principle |
Description |
|---|---|
Capture and Convey |
Collect runoff and route it safely to outfalls or detention systems |
Detain and Retain |
Temporarily store runoff to reduce peak flow and promote infiltration |
Treat and Filter |
Remove sediments, nutrients, and contaminants before discharge |
Decentralize |
Use distributed systems (e.g., bioswales, rain gardens) to manage runoff locally |
Design for Extremes |
Account for climate change, intense storms, and future urbanization |
Integrate with Land Use |
Align stormwater design with zoning, transportation, and green space plans |
🌧️ Detailed Urban Stormwater Strategies#
Strategy |
Function |
Design Considerations |
Benefits |
|---|---|---|---|
Detention Basins |
Temporarily store runoff and release it slowly to reduce peak discharge |
- Sized for design storm (e.g., 10-year, 100-year) |
- Reduces downstream flooding |
Retention Ponds |
Permanently store water and promote infiltration and evapotranspiration |
- Includes forebay for sediment |
- Improves water quality |
Green Infrastructure |
Use vegetation and soil to absorb, filter, and slow runoff |
- Includes bioswales, rain gardens, green roofs |
- Reduces runoff volume |
Storm Sewers |
Convey runoff through underground pipes to outfalls or treatment systems |
- Designed for full-flow capacity |
- Rapid drainage |
Flood Routing Models |
Simulate flow paths and optimize system performance |
- Use tools like SWMM, HEC-HMS, InfoWorks |
- Predicts flood risk |
Low Impact Development (LID) |
Minimize runoff at source using decentralized, site-level solutions |
- Includes permeable pavements, cisterns, tree boxes |
- Reduces infrastructure load |
🧠 Conceptual Insight#
Urban stormwater systems are not just pipes and ponds —
they are multifunctional networks that protect cities from flooding,
improve water quality, and enhance urban livability.
🚧 Stormwater Road Inlets: Types and Design Guidelines#
Stormwater road inlets are surface drainage structures that collect runoff from streets, gutters, and adjacent areas and convey it into underground storm sewer systems. They are critical for:
Preventing street flooding
Managing surface runoff
Protecting infrastructure and public safety
🧱 Common Types of Road Inlets#
Inlet Type |
Description |
Typical Use Case |
|---|---|---|
Grate Inlet |
Horizontal grate over a box; captures flow from above |
Low points, sag areas, curb openings |
Curb Inlet |
Vertical opening in curb face; captures sheet flow along gutter |
Continuous curb lines, high-speed roads |
Combination Inlet |
Grate + curb inlet; maximizes capture efficiency |
High-flow areas, redundancy needed |
Slotted Inlet |
Long narrow slot (often trench-style); captures flow over extended length |
Parking lots, medians, flat grades |
Drop Inlet |
Vertical shaft with grate; connects directly to storm sewer |
Depressed areas, behind curbs |
📐 Design Guidelines#
🔢 Hydraulic Design#
Use Manning’s equation to estimate gutter flow: \( Q = \frac{1}{n} R^{2/3} S^{1/2} \cdot A \)
Determine capture efficiency based on inlet type, flow depth, and velocity
Ensure maximum allowable spread does not exceed traffic lane or sidewalk limits
📏 Spacing and Layout#
Inlet spacing depends on: - Street slope; - Gutter geometry; - Rainfall intensity; - Required capture rate
Use hydraulic modeling tools (e.g., SWMM, HEC-22) for precise spacing
🛠️ Structural and Site Considerations#
Ensure inlets are accessible for maintenance; - Avoid placing inlets near pedestrian crossings or driveways
Use flanking inlets near sag points to prevent bypass
🌧️ Design Storm Criteria#
Typically designed for 10-year or 25-year storm for minor systems and 100-year storm for major conveyance or critical infrastructure
Storm Drain Inlet Design Based on FHWA Guidelines#
This design methodology follows the principles outlined in the FHWA Hydraulic Engineering Circular No. 22 (HEC-22), which provides comprehensive guidance for designing storm drainage systems associated with transportation infrastructure.
Design Philosophy#
Storm drain inlets are designed to:
Intercept surface runoff from streets and pavements
Prevent excessive spread of water into travel lanes
Safely convey stormwater into underground drainage systems
The design must balance hydraulic efficiency, safety, and maintenance accessibility.
Inlet Types (HEC-22 Classification)#
Inlet Type |
Description |
Typical Use Case |
|---|---|---|
Grate Inlet |
Surface grate intercepts vertical flow |
Sag points, flat areas |
Curb Opening |
Horizontal slot intercepts gutter flow |
Continuous grades, low debris zones |
Combination Inlet |
Grate + curb opening for redundancy |
High-flow areas, sags |
Slotted Drain |
Long slot over pipe intercepts sheet flow |
Parking lots, wide pavements |
📐 Hydraulic Design Parameters#
Parameter |
Description |
|---|---|
\(( Q \)) |
Design flow rate (m³/s) |
\(( S \)) |
Longitudinal street slope (m/m) |
\(( n \)) |
Manning’s roughness coefficient |
\(( W \)) |
Gutter width (m) |
\(( d \)) |
Gutter depression depth (m) |
\(( E \)) |
Inlet capture efficiency (0–1) |
1. Gutter Flow (Manning’s Equation for Triangular Section)#
2. Captured Flow#
3. Inlet Spacing#
Design Criteria (HEC-22 Recommendations)#
Design storm: 10-year for minor systems, 100-year for major systems
Maximum spread: Typically 1.8–2.4 m into travel lane
Minimum street slope: 0.5% for curbed pavements
Clogging factor: Apply 25–50% reduction for grate inlets in sag locations
🧠 Conceptual Insight#
Road inlets are the first line of defense in urban stormwater systems —
their design must balance hydraulic performance, safety, and maintenance access.
❓ Quiz Questions#
What distinguishes a curb inlet from a grate inlet?
Why are combination inlets preferred in high-flow areas?
What factors influence inlet spacing?
How does street slope affect inlet performance?
What is the role of capture efficiency in inlet design?
Why are urban areas more prone to flooding than rural areas?
What is the difference between detention and retention?
How does green infrastructure help manage stormwater?
What role does climate change play in stormwater design?
What are key components of a decentralized stormwater system?
Reference#
Both [Drainage and (UDFCD), 2020] and [Kilgore et al., 2024] are key resources for urabn drainage design. While [Drainage and (UDFCD), 2020] provided localized, practical guidance for inlet-focused design while [Kilgore et al., 2024] provides a nationally standardized and comprehensive framework for full drainage system design incluidng water quality.
2. Simulation#
🚰 Interactive Gutter Flow and Inlet Spacing Tool#
✅ What the Code Does#
This tool estimates:
Gutter flow capacity using Manning’s equation
Inlet spacing based on inlet type and capture efficiency
Visualizes gutter geometry and maximum allowable spread
It helps urban drainage designers evaluate inlet performance and layout for street stormwater systems.
▶️ How It Works#
🔧 Hydraulic Calculations#
Manning’s Equation estimates flow in a triangular gutter: \( Q = \frac{1}{n} R^{2/3} S^{1/2} \cdot A \) where:
\(( R \)): hydraulic radius
\(( S \)): street slope
\(( n \)): Manning’s roughness
\(( A \)): flow area (triangular approximation)
Inlet Capture Efficiency varies by type (e.g., curb, grate, slotted)
Spacing is calculated as: $\( \text{Spacing} = \frac{Q_{\text{required}}}{Q_{\text{captured}}} \)$
📐 Visualization#
Plots gutter cross-section with water spread
Highlights max allowable spread and slope
Displays inlet performance vs. required flow
📊 How to Interpret Inputs#
Input Parameter |
Description |
|---|---|
|
Required flow to capture (m³/s) |
|
Street slope (m/m); affects flow velocity |
|
Manning’s roughness; varies by surface type |
|
Gutter width (m); affects flow area |
|
Gutter depth (m); affects hydraulic radius |
|
Type of inlet (Grate, Curb, Combination, Slotted) |
|
Maximum allowable water spread across street (m) |
📋 How to Interpret Outputs#
Output |
Meaning |
|---|---|
|
Flow capacity of gutter based on geometry and slope |
|
Portion of flow captured by inlet based on efficiency |
|
Distance between inlets to meet flow capture requirement |
|
Visual comparison of captured vs. required flow and gutter geometry |
📘 Interpretation Tips#
Spacing < 20 m: Frequent inlets needed; risk of excessive spread
Spacing 20–50 m: Acceptable for typical urban streets
Spacing > 50 m: May risk bypass; consider flanking or higher-efficiency inlets
Captured < Required: Warning to increase inlet size or add more inlets
🧠 Conceptual Insight#
This tool supports urban stormwater design by linking hydraulic theory
with practical inlet layout and street geometry — promoting safe and efficient drainage.
Design Workflow#
Estimate runoff using Rational Method or hydrograph
Compute gutter flow using Manning’s equation
Select inlet type and determine capture efficiency
Calculate captured flow and compare to required flow
Determine inlet spacing to meet hydraulic and safety criteria
# 📌 Run this cell in a Jupyter Notebook
import numpy as np
import matplotlib.pyplot as plt
import ipywidgets as widgets
from IPython.display import display, clear_output

# 📐 Manning's equation for gutter flow
def gutter_flow(Q, S, n, W, d):
    A = W * d / 2  # triangular cross-section approximation
    R = d / 2      # hydraulic radius
    V = (1 / n) * R**(2/3) * S**0.5
    Q_calc = A * V
    return Q_calc

# 📊 Inlet spacing calculator
def inlet_design(Q, S, n, W, d, inlet_type, max_spread):
    clear_output(wait=True)

    # Compute gutter flow capacity
    Q_gutter = gutter_flow(Q, S, n, W, d)

    # Capture efficiency by inlet type
    efficiency_dict = {
        'Grate': 0.6,
        'Curb': 0.75,
        'Combination': 0.85,
        'Slotted': 0.9
    }
    efficiency = efficiency_dict.get(inlet_type, 0.7)

    # Effective captured flow
    Q_captured = Q_gutter * efficiency

    # Estimate spacing (simplified)
    spacing = Q / Q_captured if Q_captured > 0 else np.inf

    # Plot
    plt.figure(figsize=(6, 4))
    plt.bar(['Captured Flow'], [Q_captured], color='dodgerblue')
    plt.axhline(Q, color='red', linestyle='--', label='Required Flow')
    plt.ylabel('Flow (m³/s)')
    plt.title(f'{inlet_type} Inlet Design\nEstimated Spacing ≈ {spacing:.1f} m')
    plt.legend()
    plt.grid(True)
    plt.tight_layout()
    plt.show()

    # Display summary and interpretation
    print(f"🚰 Required Flow: {Q:.2f} m³/s")
    print(f"🛣️ Street Slope: {S:.3f} m/m (Suggested: 0.005–0.02)")
    print(f"🧱 Manning's n: {n:.3f} (Typical: 0.015–0.025 for concrete/asphalt)")
    print(f"📏 Gutter Width: {W:.2f} m (Typical: 1.0–2.5 m)")
    print(f"📉 Gutter Depth: {d:.2f} m (Typical: 0.075–0.15 m)")
    print(f"🧮 Inlet Type: {inlet_type}")
    print(f"🎯 Capture Efficiency: {efficiency*100:.0f}%")
    print(f"📐 Estimated Inlet Spacing: {spacing:.1f} m")

    # Interpretation
    print("\n📘 Interpretation:")
    if spacing < 20:
        print("🔹 Inlets should be placed frequently to avoid excessive spread.")
    elif spacing < 50:
        print("🔹 Moderate spacing is acceptable for typical urban streets.")
    else:
        print("🔹 Wide spacing may risk bypass flow — consider flanking inlets or increasing capture efficiency.")

    if Q_captured < Q:
        print("⚠️ Warning: Captured flow is less than required. Consider increasing inlet size or adding more inlets.")


# 🎚️ Interactive controls
Q_slider = widgets.FloatSlider(value=0.5, min=0.1, max=5.0, step=0.1, description='Flow (m³/s)')
S_slider = widgets.FloatSlider(value=0.01, min=0.001, max=0.05, step=0.001, description='Street Slope')
n_slider = widgets.FloatSlider(value=0.016, min=0.010, max=0.030, step=0.001, description="Manning's n")
W_slider = widgets.FloatSlider(value=1.5, min=0.5, max=5.0, step=0.1, description='Gutter Width (m)')
d_slider = widgets.FloatSlider(value=0.1, min=0.05, max=0.3, step=0.01, description='Gutter Depth (m)')
inlet_dropdown = widgets.Dropdown(
    options=['Grate', 'Curb', 'Combination', 'Slotted'],
    value='Combination',
    description='Inlet Type'
)
spread_slider = widgets.FloatSlider(value=2.0, min=0.5, max=5.0, step=0.1, description='Max Spread (m)')


# 📐 Visualization function
def plot_gutter_geometry(W, d, max_spread, S):
    clear_output(wait=True)

    # Create triangular gutter profile
    x = np.linspace(0, W, 100)
    y = d * (x / W)  # linear slope

    # Plot
    plt.figure(figsize=(8, 5))
    plt.plot(x, y, label='Gutter Cross-Section', color='steelblue')
    plt.fill_between(x, 0, y, color='lightblue', alpha=0.5)

    # Max spread line
    plt.axvline(max_spread, color='red', linestyle='--', label='Max Allowable Spread')
    plt.text(max_spread + 0.1, d * 0.5, f'{max_spread:.2f} m', color='red')

    # Annotate parameters
    plt.text(W * 0.5, d + 0.02, f'Gutter Width = {W:.2f} m', ha='center')
    plt.text(W * 0.5, -0.05, f'Depression Depth = {d:.2f} m', ha='center')
    plt.text(W * 0.5, -0.10, f'Street Slope = {S:.3f} m/m', ha='center')

    plt.xlabel('Distance from Curb (m)')
    plt.ylabel('Water Depth (m)')
    plt.title('Maximum Spread and Gutter Geometry')
    plt.grid(True)
    plt.legend()
    plt.ylim(-0.15, d + 0.1)
    plt.gca().invert_yaxis()  # 🔄 Invert y-axis to show depression

    plt.tight_layout()
    plt.show()


# 🎚️ Interactive controls
W_slider = widgets.FloatSlider(value=2.0, min=1.0, max=5.0, step=0.1, description='Gutter Width (m)')
d_slider = widgets.FloatSlider(value=0.1, min=0.05, max=0.3, step=0.01, description='Depression Depth (m)')
spread_slider = widgets.FloatSlider(value=2.0, min=0.5, max=5.0, step=0.1, description='Max Spread (m)')
S_slider = widgets.FloatSlider(value=0.01, min=0.001, max=0.05, step=0.001, description='Street Slope')


interactive_plot = widgets.interactive(
    plot_gutter_geometry,
    W=W_slider,
    d=d_slider,
    max_spread=spread_slider,
    S=S_slider
)

display(interactive_plot)


interactive_plot = widgets.interactive(
    inlet_design,
    Q=Q_slider,
    S=S_slider,
    n=n_slider,
    W=W_slider,
    d=d_slider,
    inlet_type=inlet_dropdown,
    max_spread=spread_slider
)

display(interactive_plot)
3. Simulation#
🧮 Interactive Detention Pond Sizing Tool#
✅ What the Code Does#
This tool estimates the required detention pond volume for urban stormwater management using a simplified hydrologic approach. It accounts for:
Peak runoff generation
Site-specific adjustments (soil type, terrain slope, groundwater table)
Outlet structure efficiency
It helps designers explore how different parameters influence pond sizing.
▶️ How It Works#
Hydrologic Calculations
Peak inflow rate: $\( Q_{\text{peak}} = C \cdot i \cdot A \)$
Inflow volume (triangular hydrograph): $\( V_{\text{in}} = 0.5 \cdot Q_{\text{peak}} \cdot t \)$
Outflow volume: $\( V_{\text{out}} = Q_{\text{out}} \cdot t \)$
Required storage: $\( V_{\text{required}} = V_{\text{in}} - V_{\text{out}} \)$
Site Adjustments
Soil Type: Adjusts for infiltration capacity
Terrain Slope: Affects pond geometry and depth
Groundwater Table: Limits excavation depth
Outlet Structure: Improves discharge efficiency
Final Output
Displays peak inflow, raw volume, adjusted volume, and interpretive notes
📊 How to Interpret Inputs and Outputs#
🔢 Inputs#
Parameter |
Description |
|---|---|
|
Runoff coefficient (0.3–0.95); higher for urban areas |
|
Rainfall intensity (mm/hr); based on design storm |
|
Drainage area (ha); larger areas generate more runoff |
|
Storm duration (minutes); affects total volume |
|
Permissible outflow rate (m³/s); lower rates require more detention |
|
Affects infiltration and retention (e.g., clay vs. sand) |
|
Influences pond geometry and depth feasibility |
|
Groundwater depth; high tables limit excavation |
|
Discharge structure; multi-stage and infiltration reduce volume |
📋 Outputs#
Output |
Interpretation |
|---|---|
|
Maximum runoff rate entering the pond |
|
Volume required without site adjustments |
|
Final recommended volume considering soil, slope, groundwater, and outlet type |
|
Explains how each input affects the final volume |
🧠 Conceptual Insight#
This tool integrates hydrologic, geotechnical, and hydraulic factors
to support resilient and context-sensitive detention pond design.
import numpy as np
import ipywidgets as widgets
from ipywidgets import interact
from IPython.display import clear_output

# 📌 Interactive function
def detention_pond_sizing(C, i, A, duration_min, Q_out, soil_type, slope, gw_table, outlet_type):
    clear_output(wait=True)

    # Convert units
    A_m2 = A * 10_000                     # hectares to m²
    i_mps = i / 3600 / 1000               # mm/hr to m/s
    duration = duration_min * 60         # minutes to seconds

    # Compute peak inflow
    Q_peak = C * i_mps * A_m2            # m³/s
    V_in = 0.5 * Q_peak * duration       # triangular hydrograph
    V_out = Q_out * duration             # constant outflow
    V_required = max(V_in - V_out, 0)    # required storage

    # 🌿 Soil infiltration adjustment
    infiltration_factor = {
        'Clay': 1.0,
        'Silt': 0.9,
        'Loam': 0.75,
        'Sand': 0.6
    }[soil_type]

    V_adjusted = V_required * infiltration_factor

    # 🧱 Slope adjustment
    if slope == 'Flat':
        slope_factor = 1.2
    elif slope == 'Moderate':
        slope_factor = 1.0
    else:  # Steep
        slope_factor = 0.85

    V_adjusted *= slope_factor

    # 💧 Groundwater table adjustment
    if gw_table == 'High':
        gw_factor = 1.2
    elif gw_table == 'Moderate':
        gw_factor = 1.0
    else:  # Deep
        gw_factor = 0.9

    V_adjusted *= gw_factor

    # 🛠️ Outlet structure influence
    outlet_factor = {
        'Orifice': 1.0,
        'Weir': 0.95,
        'Multi-stage': 0.85,
        'Infiltration': 0.75
    }[outlet_type]

    V_final = V_adjusted * outlet_factor

    # 📋 Output
    print(f"🌧️ Peak Inflow Rate: {Q_peak:.2f} m³/s")
    print(f"📦 Raw Storage Volume (no adjustment): {V_required:.1f} m³")
    print(f"🛠️ Adjusted Storage Volume (site + outlet): {V_final:.1f} m³")
    print("\n🔍 Interpretation:")
    print(f"- Soil Type '{soil_type}' affects infiltration and retention.")
    print(f"- Terrain '{slope}' influences pond shape and depth.")
    print(f"- Groundwater table '{gw_table}' may limit excavation depth.")
    print(f"- Outlet type '{outlet_type}' improves discharge efficiency.")
    print(f"\n✅ Recommended Detention Volume: {V_final:.1f} m³")

# 🎛️ Interactive controls
interact(detention_pond_sizing,
         C=widgets.FloatSlider(value=0.75, min=0.3, max=0.95, step=0.05, description='Runoff Coeff.'),
         i=widgets.FloatSlider(value=100, min=10, max=200, step=5, description='Rainfall Intensity (mm/hr)'),
         A=widgets.FloatSlider(value=5, min=0.1, max=50, step=0.1, description='Area (ha)'),
         duration_min=widgets.IntSlider(value=60, min=10, max=180, step=5, description='Storm Duration (min)'),
         Q_out=widgets.FloatSlider(value=0.5, min=0.1, max=5.0, step=0.1, description='Outflow Rate (m³/s)'),
         soil_type=widgets.Dropdown(options=['Clay', 'Silt', 'Loam', 'Sand'], description='Soil Type'),
         slope=widgets.Dropdown(options=['Flat', 'Moderate', 'Steep'], description='Terrain Slope'),
         gw_table=widgets.Dropdown(options=['High', 'Moderate', 'Deep'], description='Groundwater Table'),
         outlet_type=widgets.Dropdown(options=['Orifice', 'Weir', 'Multi-stage', 'Infiltration'], description='Outlet Structure'));
4. Self-Assessment#
Storm Drain Inlet Design: Quiz & Reflection#
This section helps reinforce key concepts from the storm drain inlet design model using Manning’s equation and FHWA guidelines.
Conceptual Questions#
What is the role of Manning’s roughness coefficient (n) in gutter flow calculations?
A. It increases flow velocity
B. It accounts for surface friction
C. It represents water depth
D. It controls inlet spacing
Which inlet type typically has the highest capture efficiency?
A. Grate
B. Curb
C. Combination
D. Slotted
Why is the y-axis inverted in the gutter geometry plot?
A. To match the direction of flow
B. To simulate water rising
C. To visually represent depression in the street
D. To show elevation above the curb
What happens if the captured flow is less than the required flow?
A. The inlet spacing increases
B. The street slope must be reduced
C. Bypass flow may occur
D. The depression depth becomes irrelevant
Calculation Challenge#
Given:
Flow rate \(( Q = 0.8 \ \text{m}^3/\text{s} \))
Street slope \(( S = 0.015 \))
Manning’s \(( n = 0.016 \))
Gutter width \(( W = 2.0\ \text{m} \))
Depression depth \(( d = 0.1 \ \text{m} \))
Inlet type = Combination
Tasks:
Calculate the gutter flow capacity using Manning’s equation.
Estimate the captured flow using the inlet efficiency.
Determine the required inlet spacing.
Reflection Questions#
How does increasing the street slope affect the gutter flow and inlet spacing?
Why might a designer choose a combination inlet over a grate or curb inlet in a sag location?
What are the risks of exceeding the maximum allowable spread in urban streets?
How could this model be extended to account for clogging, debris, or inlet bypass flow?
Design Insight#
“Inlet spacing is not just a hydraulic decision — it’s a safety, maintenance, and cost decision. Balancing flow capture with accessibility and resilience is key to effective urban drainage.”