
Chapter 3 Hydraulics: Arch Dam Design#
1. Introduction#
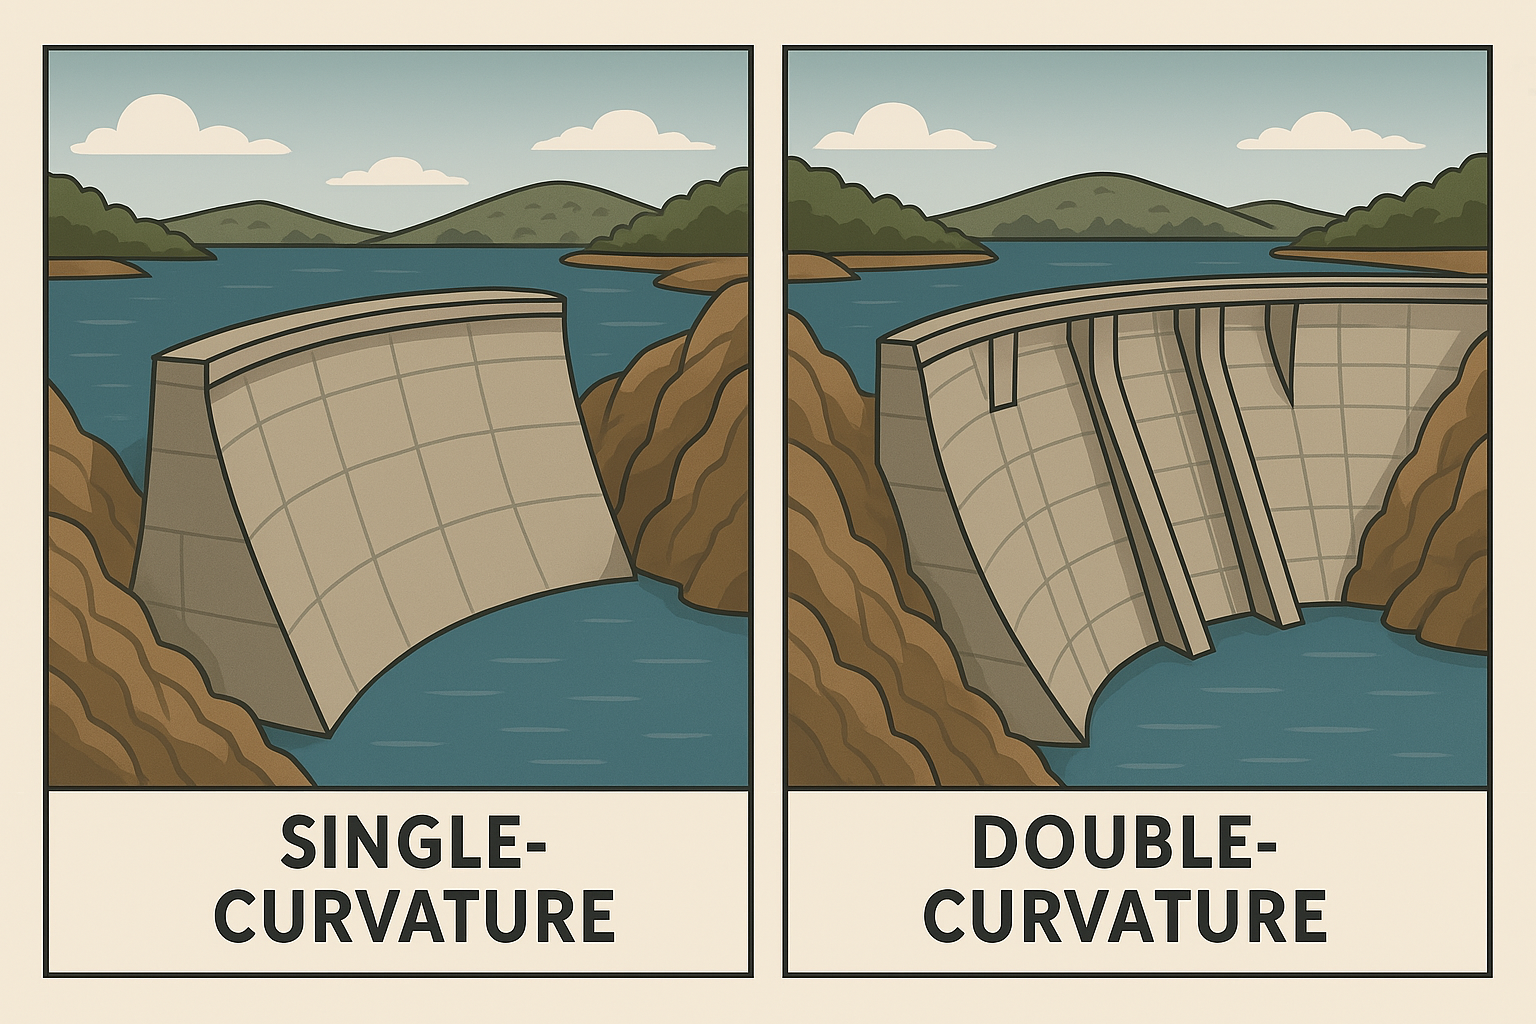
Fig. 13 **Figrue 3.13 **: Types of Arch Dam.#
Arch Dam Design: Theory, Equations & Types#
Arch dams are curved concrete structures that transfer water pressure laterally into the abutments. Their efficiency comes from their ability to use arch action rather than relying solely on gravity.
Design Philosophy#
Arch dams are best suited for narrow, steep-sided valleys.
The dam’s curvature allows it to transfer hydrostatic pressure into the canyon walls.
Structural behavior depends on arch geometry, thickness, and abutment strength.
Types of Arch Dams#
1. Single Curvature Arch Dam#
Curved only in the horizontal plane.
Vertical profile is straight or slightly tapered.
Simpler to construct but less efficient in load distribution.
2. Double Curvature Arch Dam#
Curved in both horizontal and vertical planes.
Forms a shell-like structure (like a dome).
More efficient in resisting loads and minimizing concrete volume.
Feature |
Single Curvature |
Double Curvature |
|---|---|---|
Curvature |
Horizontal only |
Horizontal + Vertical |
Structural Efficiency |
Moderate |
High |
Concrete Volume |
Higher |
Lower |
Construction |
Simpler |
Complex |
Load Distribution |
Arch action only |
Arch + shell action |
Key Equations#
1. Hydrostatic Pressure#
Where:
\(( p \)) = pressure at depth \(( h \))
\(( \gamma_w \)) = unit weight of water (≈ 9.81 kN/m³)
2. Arch Action (Horizontal Load Transfer)#
Where:
\(( F \)) = force transferred to abutments
\(( p \)) = water pressure
\(( r \)) = radius of curvature
\(( t \)) = thickness of arch
\(( L \)) = span of arch
3. Hoop Stress in Arch Ring#
Where:
\(( \sigma \)) = hoop stress
\(( p \)) = pressure
\(( r \)) = radius
\(( t \)) = thickness
4. Stability Checks#
Sliding: Check horizontal thrust vs. friction at base
Overturning: Evaluate moment equilibrium
Bearing Pressure: Ensure stress on foundation < allowable
Design Parameters#
Parameter |
Typical Range |
|---|---|
Radius of Curvature |
2–5 × dam height |
Arch Thickness |
3–10 m (varies with height) |
Height |
50–300 m |
Abutment Angle |
> 60° |
🌍 World-Famous Arch Dams: Geometry, Location & Structural Type#
Arch dams are marvels of structural engineering, using curvature to transfer hydrostatic pressure into abutments. Below is a summary of some of the most iconic arch dams around the world.
Summary Table: Famous Arch Dams#
Dam Name |
Country |
Height (m) |
Type |
Curvature |
Notable Features |
|---|---|---|---|---|---|
Hoover Dam |
USA |
221 |
Arch-Gravity |
Single Curvature |
Iconic structure; spans Black Canyon |
Jingping-I Dam |
China |
305 |
Concrete Arch |
Double Curvature |
Tallest arch dam in the world |
Enguri Dam |
Georgia |
272 |
Concrete Arch |
Double Curvature |
One of the highest dams in Europe |
Katse Dam |
Lesotho |
185 |
Concrete Arch |
Double Curvature |
Key part of Lesotho Highlands Project |
Gordon Dam |
Australia |
140 |
Concrete Arch |
Double Curvature |
Largest double-curved dam in Australia |
Monticello Dam |
USA (California) |
93 |
Concrete Arch |
Single Curvature |
Famous for its morning glory spillway |
Contra Dam |
Switzerland |
220 |
Concrete Arch |
Single Curvature |
Featured in James Bond’s GoldenEye |
Morrow Point Dam |
USA (Colorado) |
143 |
Concrete Arch |
Double Curvature |
USBR-designed; slender and efficient |
Idukki Dam |
India (Kerala) |
168 |
Concrete Arch |
Double Curvature |
One of Asia’s largest arch dams |
Daniel-Johnson Dam |
Canada |
214 |
Multiple Arch |
Multi-Plane |
Largest multiple-arch dam in the world |
Geometry Notes#
Single Curvature: Curved in horizontal plane only; simpler but less efficient.
Double Curvature: Curved in both horizontal and vertical planes; shell-like behavior.
Multiple Arch: Series of contiguous arches supported by buttresses; rare today due to complexity.
Site Selection Criteria#
Arch dams are typically built in:
Narrow, V-shaped valleys
Strong rock abutments
Locations requiring minimal concrete volume
📚 Foundational Literature#
[Novak et al., 2007] emphasizes the structural efficiency of arch dams in narrow valleys with strong abutments (e.g., constant radius, constant angle, and double curvature), highlighting how arch action transfers loads to abutments. The book also discusses optimal geometry, load conditions, and material economy, making arch dams a technically elegant but site-specific solution.
2. Simulation#
✅ What the Code Does#
This tool:
Calculates and visualizes the horizontal curvature, thickness profile, and stress distribution of an arch dam
Uses geometric and hydrostatic principles to estimate:
Radius of curvature
Water pressure distribution
Stress along the dam height
Provides interactive sliders to explore how design parameters affect dam performance
▶️ How It Works#
🔧 Geometry and Calculations#
Radius of Curvature: \( R = \frac{L}{2 \cdot \sin(\theta / 2)} \) where \(( L \)) is crest width and \(( \theta \)) is central angle in radians
Arch Profile: Calculated using circular geometry
Thickness Profile: Linearly interpolated from crest to base
Hydrostatic Pressure: \( p = \rho g h \) where \(( h \)) is depth from water surface
Stress Distribution: $\( \sigma = \frac{p}{t} \)\( where \)( t $) is local thickness
📊 Visualization Panels#
Arch Cross-Section: Shows dam curvature and thickness
Vertical Thickness Profile: Displays how thickness varies with height
Stress Distribution: Plots hydrostatic stress along dam height
📊 How to Interpret Inputs#
Input Parameter |
Description |
|---|---|
|
Total vertical height of the dam |
|
Horizontal span of the dam at the crest |
|
Horizontal curvature angle; affects radius and arch shape |
|
Thickness of the dam at the base |
|
Thickness of the dam at the crest |
📋 How to Interpret Outputs#
Output Panel |
Interpretation |
|---|---|
Arch Cross-Section |
Visualizes dam curvature and thickness envelope |
Vertical Thickness Profile |
Shows how dam thickness increases from crest to base |
Stress Distribution |
Indicates hydrostatic stress variation; higher near base due to water depth |
📘 Design Insight#
Thicker base helps resist higher pressure and stress
Curvature improves structural efficiency by transferring loads to abutments
Stress plot helps assess potential overstress zones and guide reinforcement
🧠 Conceptual Insight#
This tool supports preliminary arch dam design by linking geometry, hydrostatics, and stress analysis —
enabling designers to explore curvature, thickness, and pressure effects interactively.
import numpy as np
import matplotlib.pyplot as plt
import ipywidgets as widgets
from IPython.display import display

# 📐 Arch dam geometry calculator (horizontal curvature only)
def arch_dam_geometry(H, L, theta_deg, t_base, t_crest):
    theta = np.radians(theta_deg)
    R = L / (2 * np.sin(theta / 2))  # radius of curvature
    x = np.linspace(-L / 2, L / 2, 300)
    y = R - np.sqrt(R**2 - x**2)  # arch profile

    # Dam thickness profile (linear from crest to base)
    thickness = t_crest + (t_base - t_crest) * (y / max(y))

    # Water pressure distribution (hydrostatic)
    pressure = 9.81 * 1000 * y  # Pa

    # Stress distribution (simplified: pressure / thickness)
    stress = pressure / thickness / 1e6  # MPa

    # Vertical profile (from base to crest)
    y_vert = np.linspace(0, H, 100)
    thickness_vert = t_crest + (t_base - t_crest) * (y_vert / H)
    pressure_vert = 9.81 * 1000 * y_vert
    stress_vert = pressure_vert / thickness_vert / 1e6  # MPa

    return x, y, thickness, pressure, stress, R, y_vert, thickness_vert, stress_vert

# 📊 Plot function
def plot_arch_dam(H, L, theta_deg, t_base, t_crest):
    x, y, thickness, pressure, stress, R, y_vert, thickness_vert, stress_vert = arch_dam_geometry(
        H, L, theta_deg, t_base, t_crest)

    fig, axs = plt.subplots(1, 3, figsize=(18, 5))

    # ✂️ Cross-section (horizontal curvature)
    axs[0].plot(x, y, label="Dam Profile", color="darkblue")
    axs[0].fill_between(x, y, y + thickness, color="lightblue", alpha=0.5, label="Dam Thickness")
    axs[0].set_xlabel("Horizontal Distance (m)")
    axs[0].set_ylabel("Height from Base (m)")
    axs[0].set_title(f"Arch Dam Cross-Section — Radius = {R:.1f} m")
    axs[0].grid(True)
    axs[0].legend()
    axs[0].set_aspect('equal')

    # 📐 Vertical profile (thickness vs height)
    axs[1].plot(thickness_vert, y_vert, color="darkgreen", linewidth=2)
    axs[1].fill_betweenx(y_vert, 0, thickness_vert, color="lightgreen", alpha=0.5)
    axs[1].set_xlabel("Thickness (m)")
    axs[1].set_ylabel("Height from Base (m)")
    axs[1].set_title("Vertical Profile of Dam Thickness")
    axs[1].grid(True)
    axs[1].invert_yaxis()

    # 💥 Stress distribution
    axs[2].plot(stress_vert, y_vert, color="crimson", linewidth=2)
    axs[2].fill_betweenx(y_vert, 0, stress_vert, color="mistyrose", alpha=0.5)
    axs[2].set_xlabel("Stress (MPa)")
    axs[2].set_ylabel("Height from Base (m)")
    axs[2].set_title("Stress Distribution Along Height")
    axs[2].grid(True)
    axs[2].invert_yaxis()

    plt.tight_layout()
    plt.show()

# 🎛️ Interactive controls
H_slider = widgets.FloatSlider(value=100, min=30, max=300, step=10, description='Dam Height H (m)')
L_slider = widgets.FloatSlider(value=150, min=50, max=500, step=10, description='Crest Width L (m)')
theta_slider = widgets.FloatSlider(value=120, min=60, max=180, step=5, description='Central Angle θ (°)')
t_base_slider = widgets.FloatSlider(value=20, min=5, max=50, step=1, description='Base Thickness (m)')
t_crest_slider = widgets.FloatSlider(value=5, min=1, max=20, step=1, description='Crest Thickness (m)')

ui = widgets.VBox([
    H_slider, L_slider, theta_slider, t_base_slider, t_crest_slider
])

out = widgets.interactive_output(plot_arch_dam, {
    'H': H_slider,
    'L': L_slider,
    'theta_deg': theta_slider,
    't_base': t_base_slider,
    't_crest': t_crest_slider
})

display(ui, out)
3. Self-Assessment#
Arch Dam Analysis: Quiz, Conceptual & Reflective Questions#
This module reinforces understanding of arch dam geometry, hydrostatic pressure, and stress distribution using interactive simulation. It supports learning through multiple-choice questions, conceptual prompts, and reflective challenges.
Conceptual Questions#
What does the central angle ( \theta ) control in an arch dam?
A. The height of the dam
B. The radius of curvature
C. The base thickness
D. The water pressure
Why is the radius of curvature ( R ) calculated using the crest width and central angle?
A. To determine the dam’s vertical profile
B. To estimate hydrostatic pressure
C. To define the horizontal arch geometry
D. To calculate stress at the base
Which parameter most directly affects hydrostatic pressure at a given point?
A. Crest width
B. Dam thickness
C. Water depth
D. Central angle
Why does stress increase toward the base of the dam?
A. Because pressure increases with depth
B. Because thickness decreases
C. Because curvature is tighter
D. Because the radius increases
What is the primary structural advantage of an arch dam?
A. It resists uplift pressure
B. It transfers load to abutments
C. It stores more water than gravity dams
D. It requires no foundation
Interpretation#
Why is the arch profile computed using a circular segment formula?
How does the linear thickness gradient from crest to base influence stress distribution?
Why is stress calculated as pressure divided by thickness? What assumptions are implicit?
How would increasing the central angle affect the radius and structural behavior?
What simplifications are made in this model compared to full 3D finite element analysis?
###Reflective Questions
How does curvature help an arch dam resist hydrostatic pressure more efficiently than a gravity dam?
Why is it important to visualize stress distribution along the dam height?
What are the trade-offs between increasing base thickness and increasing curvature?
How could this model be extended to include uplift pressure, temperature effects, or seismic loads?
In what scenarios would an arch dam be preferred over other dam types (e.g., buttress, gravity, embankment)?